Working with xarray

TLViz recommends storing your datasets as xarray DataArrays, which supports labelled multi-way datasets, so the metadata is stored together with the dataset in one object.

This example shows how you can create and work with xarray DataArrays. For this, we will create a simulated dataset where the modes represent time-of-day, day-of-week and month and the entries represent some count value.

Imports and utilities

import matplotlib.pyplot as plt
import numpy as np
import xarray as xr

rng = np.random.default_rng(0)

Creating the simulated dataset

numpy_data = rng.poisson(10, size=(24, 7, 12))
hour_label = range(1, 25)
weekday_label = ["Mon", "Tue", "Wed", "Thu", "Fri", "Sat", "Sun"]
month_label = ["Jan", "Feb", "Mar", "Apr", "May", "Jun", "Jul", "Aug", "Sep", "Oct", "Nov", "Dec"]

Storing this dataset as an xarray data array

dataset = xr.DataArray(
    data=numpy_data,
    coords={
        "month": month_label,
        "day-of-week": weekday_label,
        "hour": hour_label,
    },
    dims=["hour", "day-of-week", "month"]
)
dataset
<xarray.DataArray (hour: 24, day-of-week: 7, month: 12)>
array([[[11,  2, 11, ..., 11, 12, 12],
        [ 6, 10, 10, ..., 13, 14,  8],
        [ 9,  7,  9, ..., 10,  9, 10],
        ...,
        [ 8, 13, 18, ..., 14,  9, 13],
        [ 8, 14,  8, ..., 10,  8, 12],
        [11, 18, 10, ..., 14, 10, 12]],

       [[12, 10,  5, ..., 13, 13,  9],
        [10,  9,  6, ..., 10,  9,  6],
        [15, 11, 10, ..., 15, 12,  6],
        ...,
        [13, 10,  4, ..., 10, 17,  9],
        [13, 13, 12, ..., 13, 11,  5],
        [ 9, 12, 12, ..., 12, 11, 16]],

       [[15,  7, 13, ...,  9, 10, 11],
        [10, 11,  8, ...,  9, 10,  8],
        [ 6,  9, 11, ..., 10, 12,  8],
        ...,
...
        ...,
        [13, 14,  9, ..., 17,  5, 10],
        [ 9, 18, 17, ...,  6, 13,  7],
        [ 5, 13,  6, ..., 16, 13,  8]],

       [[15, 11,  9, ..., 12, 12, 17],
        [11,  9, 13, ..., 12, 11,  6],
        [ 9,  9,  9, ..., 17,  8, 11],
        ...,
        [14, 10, 14, ...,  6, 10,  7],
        [ 7, 13, 12, ..., 10, 10, 20],
        [14, 15,  8, ...,  9, 10,  9]],

       [[ 5,  8,  6, ...,  6, 12, 10],
        [ 6,  6,  8, ...,  8,  8, 13],
        [ 8,  3, 11, ..., 10,  9,  7],
        ...,
        [12,  7,  5, ...,  9, 15,  5],
        [ 9,  5, 13, ..., 10, 11, 13],
        [ 9, 13, 13, ...,  9, 17,  8]]])
Coordinates:
  * month        (month) <U3 'Jan' 'Feb' 'Mar' 'Apr' ... 'Sep' 'Oct' 'Nov' 'Dec'
  * day-of-week  (day-of-week) <U3 'Mon' 'Tue' 'Wed' 'Thu' 'Fri' 'Sat' 'Sun'
  * hour         (hour) int64 1 2 3 4 5 6 7 8 9 ... 16 17 18 19 20 21 22 23 24


Slicing DataArrays

There are two common ways to slice xarray DataArrays, either by numerical index or by coordinate.

dataset[0, 0, 0]
<xarray.DataArray ()>
array(11)
Coordinates:
    month        <U3 'Jan'
    day-of-week  <U3 'Mon'
    hour         int64 1


dataset.loc[1, "Mon", "Jan"]
<xarray.DataArray ()>
array(11)
Coordinates:
    month        <U3 'Jan'
    day-of-week  <U3 'Mon'
    hour         int64 1


dataset.loc[{"month": "Jan", "hour": 1, "day-of-week": "Mon"}]
<xarray.DataArray ()>
array(11)
Coordinates:
    month        <U3 'Jan'
    day-of-week  <U3 'Mon'
    hour         int64 1


Arithmetic on DataArrays

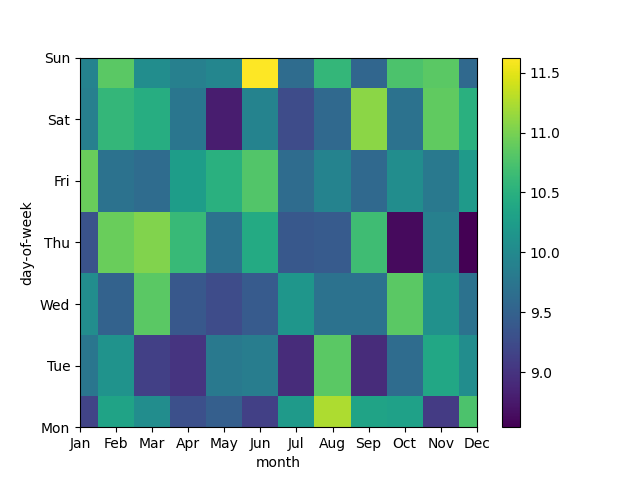
xarray includes functionality that makes it very easy to perform reduction operations, such as averages and standard deviations across the different modes of a dataset. Below, we compute the average across the hour mode.

dataset.mean("hour")
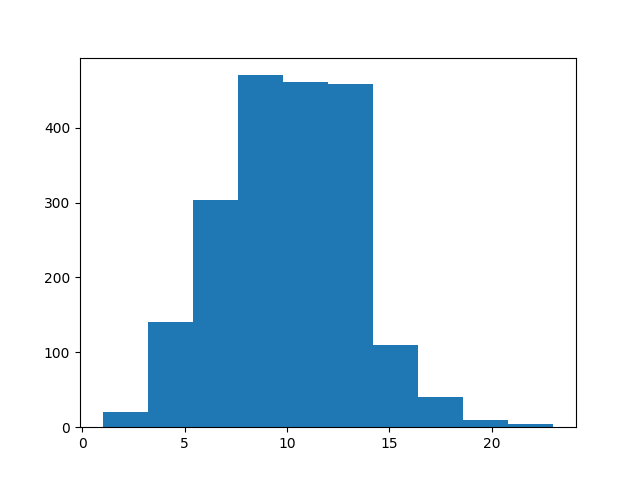
<xarray.DataArray (day-of-week: 7, month: 12)>
array([[ 9.16666667, 10.33333333, 10.04166667,  9.29166667,  9.45833333,
         9.125     , 10.20833333, 11.25      , 10.33333333, 10.29166667,
         9.08333333, 10.75      ],
       [ 9.75      , 10.125     ,  9.125     ,  9.        ,  9.79166667,
         9.83333333,  8.91666667, 10.83333333,  8.91666667,  9.625     ,
        10.375     , 10.04166667],
       [10.04166667,  9.5       , 10.83333333,  9.375     ,  9.25      ,
         9.41666667, 10.16666667,  9.70833333,  9.70833333, 10.83333333,
        10.08333333,  9.70833333],
       [ 9.33333333, 10.91666667, 11.04166667, 10.625     ,  9.70833333,
        10.41666667,  9.375     ,  9.41666667, 10.66666667,  8.625     ,
         9.875     ,  8.54166667],
       [10.91666667,  9.70833333,  9.625     , 10.25      , 10.5       ,
        10.79166667,  9.625     ,  9.91666667,  9.58333333, 10.04166667,
         9.79166667, 10.20833333],
       [ 9.875     , 10.58333333, 10.45833333,  9.75      ,  8.79166667,
         9.91666667,  9.25      ,  9.58333333, 11.08333333,  9.70833333,
        10.875     , 10.5       ],
       [ 9.91666667, 10.83333333, 10.04166667,  9.875     ,  9.95833333,
        11.625     ,  9.625     , 10.58333333,  9.54166667, 10.75      ,
        10.83333333,  9.58333333]])
Coordinates:
  * month        (month) <U3 'Jan' 'Feb' 'Mar' 'Apr' ... 'Sep' 'Oct' 'Nov' 'Dec'
  * day-of-week  (day-of-week) <U3 'Mon' 'Tue' 'Wed' 'Thu' 'Fri' 'Sat' 'Sun'


Plotting DataArrays

DataArrays also provide powerful plotting functionality. You can, for example, easily create both heatmaps and histograms. For more examples of the xarray functionality, see the xarray example gallery.

dataset.plot()
plt.show()
plot working with xarray
dataset.mean(dim="hour").plot()
plt.show()
plot working with xarray

Accessing the underlying dataset

TensorLy does not support DataArrays, so to fit tensor decomposition models, you need to use the data-attribute of the DataArray to access the NumPy array that xarray stores the data in behind the scenes.

dataset.data
array([[[11,  2, 11, ..., 11, 12, 12],
        [ 6, 10, 10, ..., 13, 14,  8],
        [ 9,  7,  9, ..., 10,  9, 10],
        ...,
        [ 8, 13, 18, ..., 14,  9, 13],
        [ 8, 14,  8, ..., 10,  8, 12],
        [11, 18, 10, ..., 14, 10, 12]],

       [[12, 10,  5, ..., 13, 13,  9],
        [10,  9,  6, ..., 10,  9,  6],
        [15, 11, 10, ..., 15, 12,  6],
        ...,
        [13, 10,  4, ..., 10, 17,  9],
        [13, 13, 12, ..., 13, 11,  5],
        [ 9, 12, 12, ..., 12, 11, 16]],

       [[15,  7, 13, ...,  9, 10, 11],
        [10, 11,  8, ...,  9, 10,  8],
        [ 6,  9, 11, ..., 10, 12,  8],
        ...,
        [16,  9, 12, ..., 13, 12, 15],
        [12, 12,  9, ..., 12, 12, 15],
        [ 8,  7, 10, ..., 10, 13,  4]],

       ...,

       [[10, 11, 10, ..., 11, 16,  9],
        [ 7, 17,  4, ..., 10, 13, 10],
        [ 9, 16, 16, ..., 16, 14,  4],
        ...,
        [13, 14,  9, ..., 17,  5, 10],
        [ 9, 18, 17, ...,  6, 13,  7],
        [ 5, 13,  6, ..., 16, 13,  8]],

       [[15, 11,  9, ..., 12, 12, 17],
        [11,  9, 13, ..., 12, 11,  6],
        [ 9,  9,  9, ..., 17,  8, 11],
        ...,
        [14, 10, 14, ...,  6, 10,  7],
        [ 7, 13, 12, ..., 10, 10, 20],
        [14, 15,  8, ...,  9, 10,  9]],

       [[ 5,  8,  6, ...,  6, 12, 10],
        [ 6,  6,  8, ...,  8,  8, 13],
        [ 8,  3, 11, ..., 10,  9,  7],
        ...,
        [12,  7,  5, ...,  9, 15,  5],
        [ 9,  5, 13, ..., 10, 11, 13],
        [ 9, 13, 13, ...,  9, 17,  8]]])

Total running time of the script: ( 0 minutes 0.187 seconds)

Gallery generated by Sphinx-Gallery