Note
Go to the end to download the full example code.
Labelled decompositions
TLViz uses labelled decompositions, implemented by storing the factor matrices as Pandas DataFrames. This makes it easy to make rich visualisations with the different decompositions. However, sometimes, we just want to plot the result directly from TensorLy. Luckily, this is also possible, even when we are using non-numpy backends.
Imports and setup
We will set the backend to pytorch to demonstrate that TLViz also works with non-numpy backends. Note that support for non-numpy backends are experiental, so if you encounter any bugs while using non-numpy backends, please let us know by using submitting a new issue.
import tlviz
import matplotlib.pyplot as plt
import tensorly as tl
from tensorly.decomposition import parafac

tl.set_backend("pytorch")
Loading the data
Here we load the Aminoacids dataset from [Bro97].
aminoacids = tlviz.data.load_aminoacids()
Loading Aminoacids dataset from:
Bro, R, PARAFAC: Tutorial and applications, Chemometrics and Intelligent Laboratory Systems, 1997, 38, 149-171
Fitting a PARAFAC model
First, we fit a PARAFAC model. Normally, you should fit models using several random initialisations, but since our goal here is not data analysis, but demonstrating how TLViz visualises decompositions with and without labels, we fit only one model.
X = tl.tensor(aminoacids.data)
cp_tensor = parafac(X, 3, init="random", random_state=0)
Plotting the components
Next, we plot the components without postprocessing the decomposition.
fig, ax = tlviz.visualisation.components_plot(cp_tensor)
plt.show()
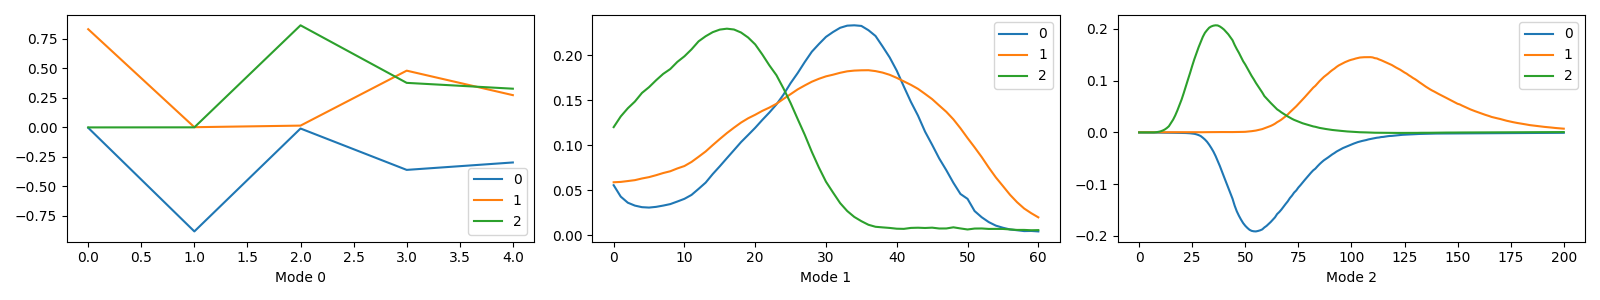
We see that the component plots have used the component vector indices for the values along the x-axis and that the x-labels get the default values, “Mode 0”, “Mode 1”, and “Mode 2”.
Plotting the components
And finally, we plot the postprocessed decomposition instead.
cp_tensor_postprocessed = tlviz.postprocessing.postprocess(cp_tensor, aminoacids)
fig, ax = tlviz.visualisation.components_plot(cp_tensor_postprocessed)
plt.show()
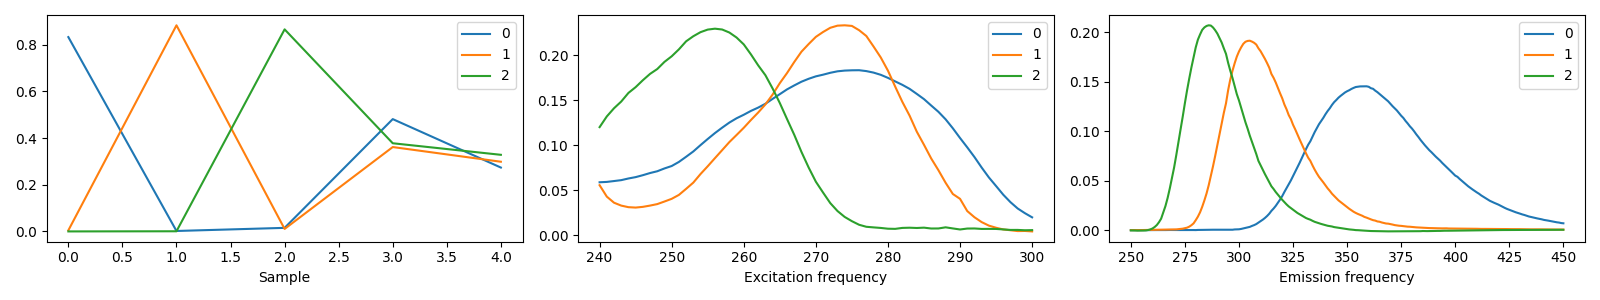
We see that by postprocessing the decomposition before plotting the components, we get a more informative plot.
The postprocessed decomposition has labels for the modes, which tlviz.visualisation.components_plot()
uses for each plot’s values along the x-axis and to give each subplot a descriptive x-label. Postprocessing
has also flipped the negative factor matrices (See
tlviz.postprocessing.resolve_cp_sign_indeterminacy() for more information on how TLViz
decides the sign of the component vectors).
Finally, we reset the backend to NumPy, because the other gallery examples assume that we use the NumPy backend.
tl.set_backend("numpy")
Total running time of the script: (0 minutes 3.497 seconds)