Note
Go to the end to download the full example code.
COVID-19 Serology Dataset Analysis with CP
Apply CP decomposition to COVID-19 Serology Dataset
# sphinx_gallery_thumbnail_number = 2
Introduction
PARAFAC (CP) decomposition is extremely useful in dimensionality reduction, allowing us to develop models that are both representative and compact while retaining crucial patterns between subjects. Here, we provide an example of how it can be applied to biomedical research.
Systems serology is a new technology that examines the antibodies from a patient’s serum, aiming to comprehensively profile the interactions between the antibodies and Fc receptors alongside other types of immunological and demographic data. Here, we will apply CP decomposition to a COVID-19 system serology dataset. In this dataset, serum antibodies of 438 samples collected from COVID-19 patients were systematically profiled by their binding behavior to SARS-CoV-2 (the virus that causes COVID-19) antigens and Fc receptors activities. Samples are labeled by the status of the patients.
Details of this analysis as well as more in-depth biological implications can be found in this work. It also includes applying tensor methods to HIV systems serology measurements and using them to predict patient status.
We first import this dataset of a panel of COVID-19 patients:
import numpy as np
import tensorly as tl
from tensorly.decomposition import parafac
from tensorly.datasets.data_imports import load_covid19_serology
from matplotlib import pyplot as plt
from matplotlib.cm import ScalarMappable

data = load_covid19_serology()
Apply CP decomposition to this dataset with Tensorly
Now we apply CP decomposition to this dataset.
comps = np.arange(1, 7)
CMTFfacs = [
    parafac(
        data.tensor, cc, tol=1e-10, n_iter_max=1000, linesearch=True, orthogonalise=2
    )
    for cc in comps
]
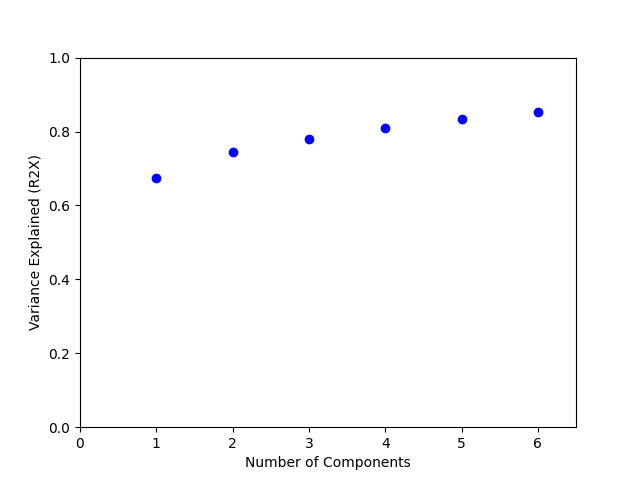
To evaluate how well CP decomposition explains the variance in the dataset, we plot the percent variance reconstructed (R2X) for a range of ranks.
def reconstructed_variance(tFac, tIn=None):
    """This function calculates the amount of variance captured (R2X) by the tensor method."""
    tMask = np.isfinite(tIn)
    vTop = np.sum(np.square(tl.cp_to_tensor(tFac) * tMask - np.nan_to_num(tIn)))
    vBottom = np.sum(np.square(np.nan_to_num(tIn)))
    return 1.0 - vTop / vBottom


fig1 = plt.figure()
CMTFR2X = np.array([reconstructed_variance(f, data.tensor) for f in CMTFfacs])
plt.plot(comps, CMTFR2X, "bo")
plt.xlabel("Number of Components")
plt.ylabel("Variance Explained (R2X)")
plt.gca().set_xlim([0.0, np.amax(comps) + 0.5])
plt.gca().set_ylim([0, 1])
(0.0, 1.0)
Inspect the biological insights from CP components
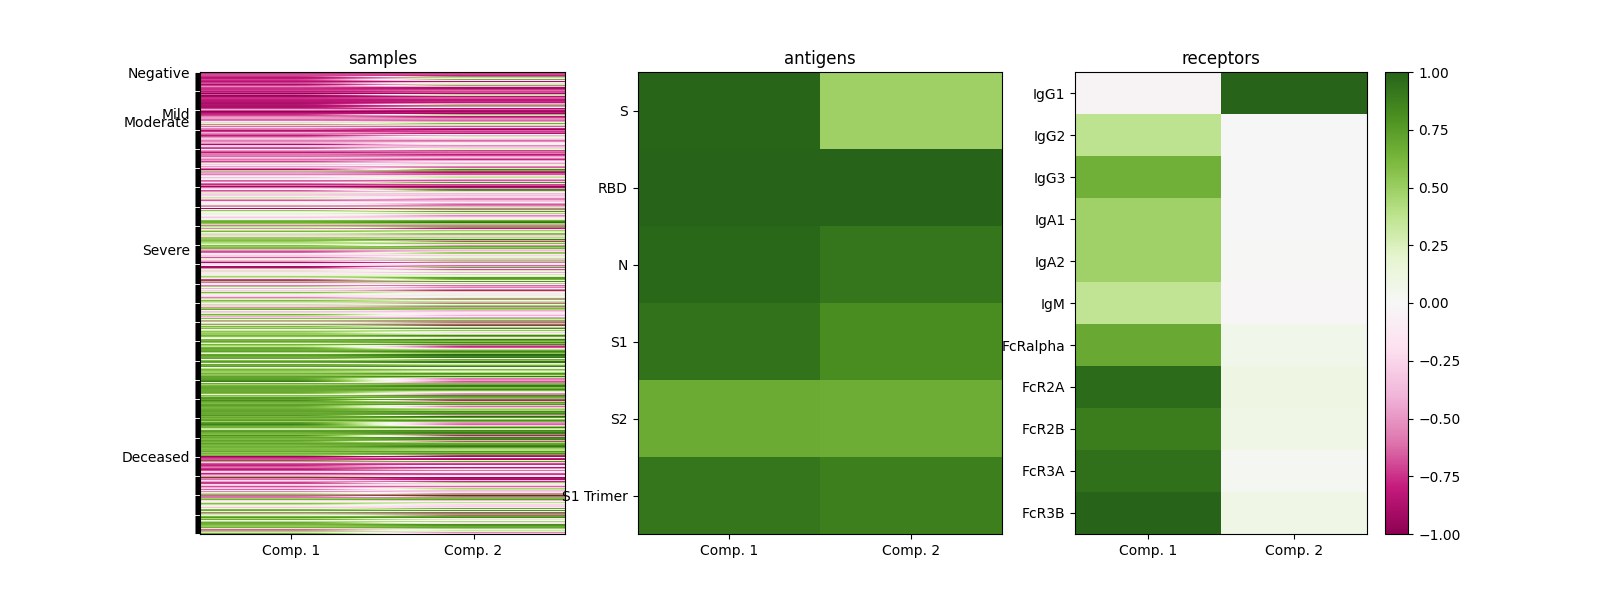
Eventually, we wish CP decomposition can bring insights to this dataset. For example, in this case, revealing the underlying trend of COVID-19 serum-level immunity. To do this, we can inspect how each component looks like on weights.
tfac = CMTFfacs[1]

# Ensure that factors are negative on at most one direction.
tfac.factors[1][:, 0] *= -1
tfac.factors[2][:, 0] *= -1

fig2, ax = plt.subplots(1, 3, figsize=(16, 6))
for ii in [0, 1, 2]:
    fac = tfac.factors[ii]
    scales = np.linalg.norm(fac, ord=np.inf, axis=0)
    fac /= scales

    ax[ii].imshow(fac, cmap="PiYG", vmin=-1, vmax=1)
    ax[ii].set_xticks([0, 1])
    ax[ii].set_xticklabels(["Comp. 1", "Comp. 2"])
    ax[ii].set_yticks(range(len(data.ticks[ii])))
    if ii == 0:
        ax[0].set_yticklabels(
            [
                (
                    data.ticks[0][i]
                    if i == 0 or data.ticks[0][i] != data.ticks[0][i - 1]
                    else ""
                )
                for i in range(len(data.ticks[0]))
            ]
        )
    else:
        ax[ii].set_yticklabels(data.ticks[ii])
    ax[ii].set_title(data.dims[ii])
    ax[ii].set_aspect("auto")

fig2.colorbar(ScalarMappable(norm=plt.Normalize(-1, 1), cmap="PiYG"))
/home/runner/work/tensorly/tensorly/examples/applications/plot_covid.py:116: MatplotlibDeprecationWarning: Unable to determine Axes to steal space for Colorbar. Using gca(), but will raise in the future. Either provide the *cax* argument to use as the Axes for the Colorbar, provide the *ax* argument to steal space from it, or add *mappable* to an Axes.
  fig2.colorbar(ScalarMappable(norm=plt.Normalize(-1, 1), cmap="PiYG"))

<matplotlib.colorbar.Colorbar object at 0x7f3e359b9970>
From the results, we can see that serum COVID-19 immunity separates into two distinct signals, represented by two CP components: a clear acute response with IgG3, IgM, and IgA, and a long-term, IgG1-specific response. Samples from patients with different symptoms can be distinguished from these two components. This indicates that CP decomposition is a great tool to find these biologically significant signals.
References
- [1] Tan, Z. C., Murphy, M. C., Alpay, H. S., Taylor, S. D., & Meyer, A. S. (2021). Tensor‐structured
decomposition improves systems serology analysis. Molecular systems biology, 17(9), e10243. https://www.embopress.org/doi/full/10.15252/msb.202110243
- [2] Zohar, T., Loos, C., Fischinger, S., Atyeo, C., Wang, C., Slein, M. D., … & Alter, G. (2020).
Compromised humoral functional evolution tracks with SARS-CoV-2 mortality. Cell, 183(6), 1508-1519. https://www.sciencedirect.com/science/article/pii/S0092867420314598
Total running time of the script: (0 minutes 3.387 seconds)