Note
Go to the end to download the full example code.
Non-negative PARAFAC Decomposition of IL-2 Response Data
Here we will provide an example of how to use non-negative PARAFAC tensor
decomposition (tensorly.decomposition.parafac) to first reduce the dimensionality
of a tensor of experimental data, and then make insights about the underlying structure
of that data.
To do this, we will work with a tensor of experimentally measured cell signaling data.
import numpy as np
import matplotlib.pyplot as plt
from tensorly.datasets import load_IL2data
from tensorly.decomposition import non_negative_parafac
from tensorly.cp_tensor import cp_normalize
Here we will load a tensor of experimentally measured cellular responses to IL-2 stimulation. IL-2 is a naturally occurring immune signaling molecule which has been engineered by pharmaceutical companies and drug designers in attempts to act as an effective immunotherapy. In order to make effective IL-2 therapies, pharmaceutical engineer have altered IL-2’s signaling activity in order to increase or decrease its interactions with particular cell types.
IL-2 signals through the Jak/STAT pathway and transmits a signal into immune cells by phosphorylating STAT5 (pSTAT5). When phosphorylated, STAT5 will cause various immune cell types to proliferate, and depending on whether regulatory (regulatory T cells, or Tregs) or effector cells (helper T cells, natural killer cells, and cytotoxic T cells, or Thelpers, NKs, and CD8+ cells) respond, IL-2 signaling can result in immunosuppression or immunostimulation respectively. Thus, when designing a drug meant to repress the immune system, potentially for the treatment of autoimmune diseases, IL-2 which primarily enacts a response in Tregs is desirable. Conversely, when designing a drug that is meant to stimulate the immune system, potentially for the treatment of cancer, IL-2 which primarily enacts a response in effector cells is desirable. In order to achieve either signaling bias, IL-2 variants with altered affinity for it’s various receptors (IL2Rα or IL2Rβ) have been designed. Furthermore IL-2 variants with multiple binding domains have been designed as multivalent IL-2 may act as a more effective therapeutic. In order to understand how these mutations and alterations affect which cells respond to an IL-2 mutant, we will perform non-negative PARAFAC tensor decomposition on our cell response data tensor.
Here, our data contains the responses of 8 different cell types to 13 different IL-2 mutants, at 4 different timepoints, at 12 standardized IL-2 concentrations. Therefore, our tensor will have shape (13 x 4 x 12 x 8), with dimensions representing IL-2 mutant, stimulation time, dose, and cell type respectively. Each measured quantity represents the amount of phosphorlyated STAT5 (pSTAT5) in a given cell population following stimulation with the specified IL-2 mutant.
response_data = load_IL2data()
IL2mutants, cells = response_data.ticks[0], response_data.ticks[3]
print(response_data.tensor.shape, response_data.dims)
(13, 4, 12, 8) ['ligands', 'times', 'doses', 'cells']
Now we will run non-negative PARAFAC tensor decomposition to reduce the dimensionality of our tensor. We will use 3 components, and normalize our resulting tensor to aid in future comparisons of correlations across components.
First we must preprocess our tensor to ready it for factorization. Our data has a few missing values, and so we must first generate a mask to mark where those values occur.
tensor_mask = np.isfinite(response_data.tensor)
Now that we’ve marked where those non-finite values occur, we can regenerate our tensor without including non-finite values, allowing it to be factorized.
response_data_fin = np.nan_to_num(response_data.tensor)
Using this mask, and finite-value only tensor, we can decompose our signaling data into three components. We will also normalize this tensor, which will allow for easier comparisons to be made between the meanings, and magnitudes of our resulting components.
sig_tensor_fact = non_negative_parafac(
    response_data_fin,
    init="random",
    rank=3,
    mask=tensor_mask,
    n_iter_max=5000,
    tol=1e-9,
    random_state=1,
)
sig_tensor_fact = cp_normalize(sig_tensor_fact)
Now we will load the names of our cell types and IL-2 mutants, in the order in which they are present in our original tensor. IL-2 mutant names refer to the specific mutations made to their amino acid sequence, as well as their valency format (monovalent or bivalent).
Finally, we label, plot, and analyze our factored tensor of data.
f, ax = plt.subplots(1, 2, figsize=(9, 4.5))

components = [1, 2, 3]
width = 0.25

lig_facs = sig_tensor_fact[1][0]
ligands = IL2mutants
x_lig = np.arange(len(ligands))

lig_rects_comp1 = ax[0].bar(x_lig - width, lig_facs[:, 0], width, label="Component 1")
lig_rects_comp2 = ax[0].bar(x_lig, lig_facs[:, 1], width, label="Component 2")
lig_rects_comp3 = ax[0].bar(x_lig + width, lig_facs[:, 2], width, label="Component 3")
ax[0].set(xlabel="Ligand", ylabel="Component Weight", ylim=(0, 1))
ax[0].set_xticks(x_lig, ligands)
ax[0].set_xticklabels(ax[0].get_xticklabels(), rotation=60, ha="right", fontsize=9)
ax[0].legend()


cell_facs = sig_tensor_fact[1][3]
x_cell = np.arange(len(cells))

cell_rects_comp1 = ax[1].bar(
    x_cell - width, cell_facs[:, 0], width, label="Component 1"
)
cell_rects_comp2 = ax[1].bar(x_cell, cell_facs[:, 1], width, label="Component 2")
cell_rects_comp3 = ax[1].bar(
    x_cell + width, cell_facs[:, 2], width, label="Component 3"
)
ax[1].set(xlabel="Cell", ylabel="Component Weight", ylim=(0, 1))
ax[1].set_xticks(x_cell, cells)
ax[1].set_xticklabels(ax[1].get_xticklabels(), rotation=45, ha="right")
ax[1].legend()

f.tight_layout()
plt.show()
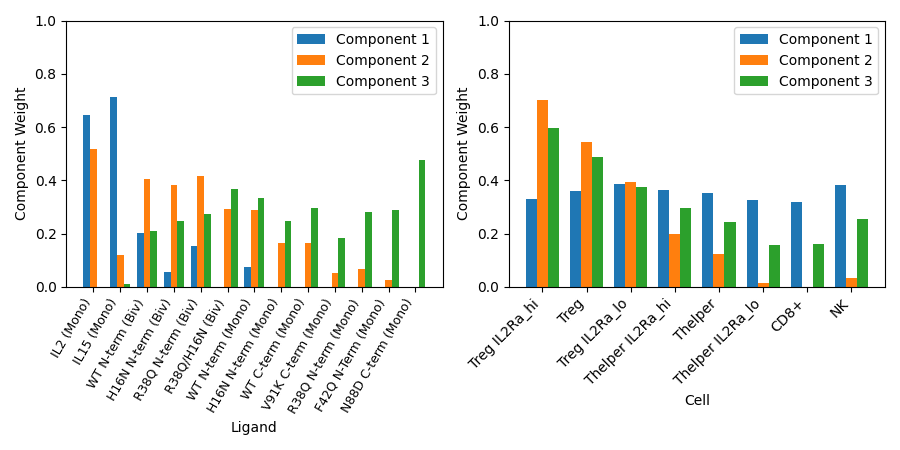
Here we observe the correlations which both ligands and cell types have with each of our three components - we can interepret our tensor factorization for looking for patterns among these correlations.
For example, we can see that bivalent mutants generally have higher correlations with component two, as do regulatory T cells. Thus we can infer that bivalent ligands activate regulatory T cells more than monovalent ligands. We also see that this relationship is strengthened by the availability of IL2Rα, one subunit of the IL-2 receptor.
This is just one example of an insight we can make using tensor factorization. By plotting the correlations which time and dose have with each component, we could additionally make inferences as to the dynamics and dose dependence of how mutations affect IL-2 signaling in immune cells.
Total running time of the script: (0 minutes 1.325 seconds)