Note
Go to the end to download the full example code.
Tucker tensor regression
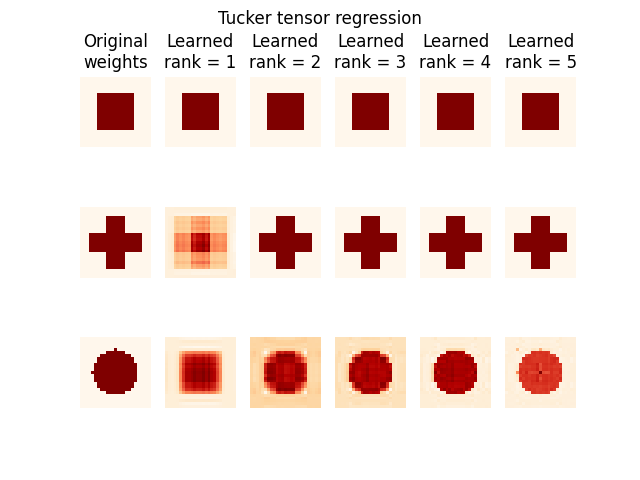
Example on how to use tensorly.regression.tucker_regression.TuckerRegressor to perform tensor regression.

fitting pattern n.0
fitting for rank = 1
fitting for rank = 2
fitting for rank = 3
fitting for rank = 4
fitting for rank = 5
fitting pattern n.1
fitting for rank = 1
fitting for rank = 2
fitting for rank = 3
fitting for rank = 4
fitting for rank = 5
fitting pattern n.2
fitting for rank = 1
fitting for rank = 2
fitting for rank = 3
fitting for rank = 4
fitting for rank = 5
import matplotlib.pyplot as plt
from tensorly.base import tensor_to_vec, partial_tensor_to_vec
from tensorly.datasets.synthetic import gen_image
from tensorly.regression.tucker_regression import TuckerRegressor
import tensorly as tl

# Parameter of the experiment
image_height = 25
image_width = 25
# shape of the images
patterns = ["rectangle", "swiss", "circle"]
# ranks to test
ranks = [1, 2, 3, 4, 5]

# Generate random samples
rng = tl.check_random_state(1)
X = tl.tensor(rng.normal(size=(1000, image_height, image_width), loc=0, scale=1))

# Parameters of the plot, deduced from the data
n_rows = len(patterns)
n_columns = len(ranks) + 1
# Plot the three images
fig = plt.figure()

for i, pattern in enumerate(patterns):

    print(f"fitting pattern n.{i}")

    # Generate the original image
    weight_img = gen_image(
        region=pattern, image_height=image_height, image_width=image_width
    )
    weight_img = tl.tensor(weight_img)

    # Generate the labels
    y = tl.dot(partial_tensor_to_vec(X, skip_begin=1), tensor_to_vec(weight_img))

    # Plot the original weights
    ax = fig.add_subplot(n_rows, n_columns, i * n_columns + 1)
    ax.imshow(tl.to_numpy(weight_img), cmap=plt.cm.OrRd, interpolation="nearest")
    ax.set_axis_off()
    if i == 0:
        ax.set_title("Original\nweights")

    for j, rank in enumerate(ranks):
        print(f"fitting for rank = {rank}")

        # Create a tensor Regressor estimator
        estimator = TuckerRegressor(
            weight_ranks=[rank, rank], tol=10e-7, n_iter_max=100, reg_W=1, verbose=0
        )

        # Fit the estimator to the data
        estimator.fit(X, y)

        ax = fig.add_subplot(n_rows, n_columns, i * n_columns + j + 2)
        ax.imshow(
            tl.to_numpy(estimator.weight_tensor_),
            cmap=plt.cm.OrRd,
            interpolation="nearest",
        )
        ax.set_axis_off()

        if i == 0:
            ax.set_title(f"Learned\nrank = {rank}")

plt.suptitle("Tucker tensor regression")
plt.show()
Total running time of the script: (0 minutes 1.139 seconds)